Table of Contents
Quantified self
Resting heart rate
2016-08-17 55
2016-08-16 56
2016-08-15 55
2016-08-14 55
2016-08-13 54
2016-08-12 54
2016-08-11 53
2016-08-10 55
Swimming
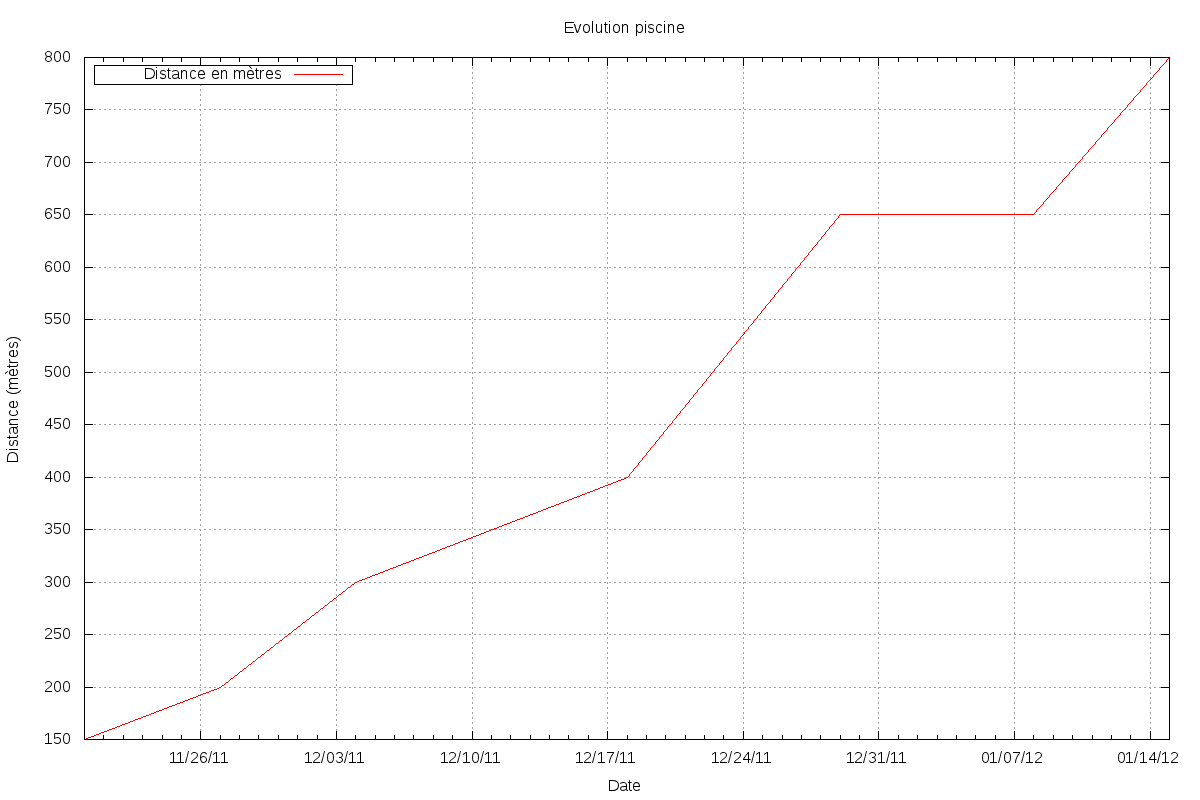
evolution-piscine.txt
2011-11-20 150 3
2011-11-27 200 4
2011-12-04 300 6
2011-12-18 400 8
2011-12-29 650 8
2012-01-08 650 13
2012-01-15 800 16
set terminal png size 1200,800
set xdata time
set timefmt "%Y-%m-%d"
set output "evolution-piscine.png"
set xrange ["2011-11-20":"2012-01-15"]
set yrange [150:1000]
set autoscale y
set ytics 50
set grid
set xlabel "Date"
set ylabel "Distance (mètres)"
set title "Evolution piscine"
set key left box
plot "evolution-piscine.txt" using 1:2 index 0 title "Distance en mètres" with lines
#plot "evolution-piscine.txt" using 1:3 index 0 title "Longueurs" with lines
